Generating graphs
Overview
In this tutorial, we are going to generate the graphs for the system used in My first simulation, in order to do this two things are needed:
- The input.mkm file used for original the simulation.
- The data generated from this simulation.
Input
In this example, the following input file is used:
&compounds
A;  	0;  1.0
B;  	0;  0.0
A*;	1;  0.0
B*;	1;  0.0
*;	1;  1.0

&reactions
#			m^2	amu	K	sigma	sticking	J/mol
HK; {A}	+ {*} => {A*};	1e-19;	28;	2.73;	1;	1;		120e3
HK; {B}	+ {*} => {B*};	1e-19;	 2;	88;	2;	1;		 80e3

#			vf	vb	Eaf	Eab
AR; {A*} => {B*};	6e11;	4e12;	65e3;	90e3

&settings
TYPE = SEQUENCERUN
PRESSURE = 10
USETIMESTAMP = 0

&runs
# Temp;	Time;	AbsTol;	RelTol
400;	1e8;	1e-12;	1e-12
500;	1e4;	1e-12;	1e-12
600;	1e1;	1e-12;	1e-12
700;	1e1;	1e-12;	1e-12
800;	1e1;	1e-12;	1e-12
900;	1e1;	1e-12;	1e-12
1000;	1e1;	1e-12;	1e-12
1100;	1e1;	1e-12;	1e-12
1200;	1e1;	1e-12;	1e-12
1300;	1e1;	1e-12;	1e-12
1400;	1e1;	1e-12;	1e-12
Running the simulation
First we perform a regular calculation.
./mkmcxx -i input.mkm
After this, a run folder is generated in which the simulation results are stored.
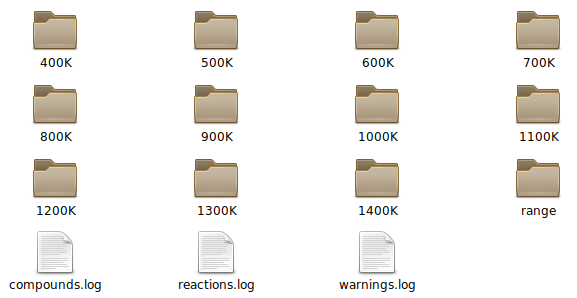
For the sake of the tutorial we will delete the graphs folder from run. This leaves us with the folders as seen in the figure to the right.
Regenerating graphs
We now have both the simulation data and the input file used to generate it. The next step is to regenerate the graph files by using the following command.
./mkmcxx -i input.mkm -o run -g
This command is similar to the regular command plus two extra directives, -o run and -g. The first directive tells the program to look for the data in the run folder. The second directive indicates that we want to generate graphs from this data.
If we now run the command we find that a graphs folder has been created inside the run folder, containing all the graphs.
conclusion remarks
When regenerating the graphs it is important that the simulation data is complete. If a data file is missing or incompletely, the program will stop and indicate what went wrong. Also, always make sure that you use the original input file, as it is used to find the location of the different data files.
